The 8 GB Lab Book · Chapter 15
Builder memory vs. runtime memory
- Board
- Jetson Orin Nano Super
- Mode
- 15W
- Setup
- TensorRT 10.3
- Summary
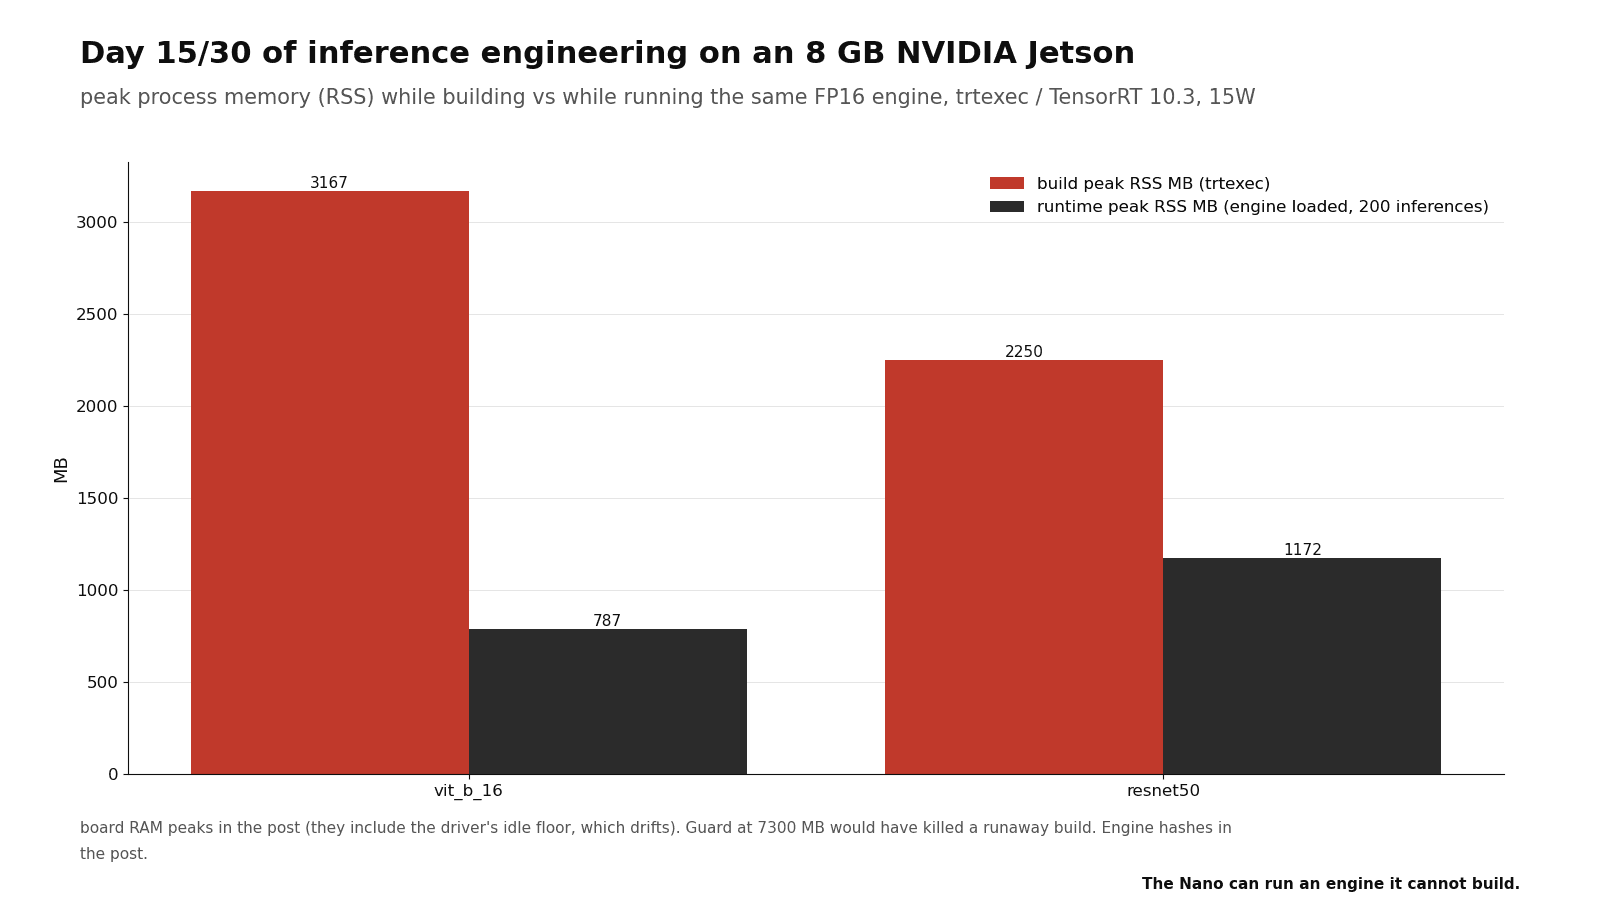
- The build peaked at 3167 MB of process RSS, under the 4096 MB workspace flag. The runtimes held 787 and 1172 MB.
What I expected
Before the run, I wrote three priors. Prior 1 was that the build would use the workspace that I offered: 4096 MB of workspace plus 172 MB of FP1616-bit floating point (half precision): half the bytes of FP32, and tensor cores run it at much higher throughput than FP32. weights plus the process. I expected a build RSSResident set size: the pages of a process's own memory that are in RAM right now, as ps and top count them; GPU allocations made through the driver are not included. near 4.5 GB and a board number almost at the 7300 guard.
Prior 2 was that the runtime cost is the TensorRT engineThe compiled, GPU-specific plan TensorRT produces from a network; it has to be rebuilt for a different GPU or TensorRT version. file plus one CUDA context. That is approximately 500 MB for vit_b_16 and 400 for resnet50.
Prior 3 was that vit_b_16 is approximately four times slower for each image than resnet50. The cause is that it has four times more MACs (paper numbers: 17.6 G against 4.1 G).
The theory
An engine is the weights; then flops per image, derived
ENGINE FILE = fp16 WEIGHTS
vit_b_16: 86 M params x 2 B = 172 MB
  measured engine 175.7 MB
resnet50: 25.6 M x 2 B = 51 MB
  measured engine 51.9 MB
= the plan itself is under 4 MB
MACs PER IMAGE, vit_b_16 (derived)
197 tokens, 768 wide, 12 layers, batch 1
linears: 12 x 197 x 768^2 x 12 = 16.7 G
attention: 2 x 197^2 x 768 x 12 = 0.7 G
17.4 GMAC = 34.9 GFLOP per image
= resnet50 (paper input): 4.1 GMAC = 8.2 GFLOP
resnet50 as the script ran it: 8.2 x 6.12 = 50.2 GFLOP
vit reached 34.9 GFLOP / 9.99 ms = 3.5 TFLOP/s. resnet50 ran at the shape in the script, which has 6.1x the pixels of the input in the paper. It did 50.2 GFLOP in 12.72 ms = 3.9 TFLOP/s. First I divided the 8.2 of the paper by 12.72 and got 0.64. That 6.1x gap (3.9 / 0.64) was my shape error, not the board. The two nets and the two prefillThe first phase of language-model inference, where the whole prompt is processed in one parallel pass to fill the KV cache; it is usually limited by compute. rates of Chapter 14, 3.75 and 3.34, are all between 3.3 and 3.9.
TFLOP/s ACHIEVED (arithmetic from measured ms)
- vit_b_16
- 3.5
- resnet50
- 3.9
- Day 14 prefill, Q8 / Q4
- 3.75 / 3.34
- fp32 cores peak
- 1.25
The setup
python3 tools/day15_build_vs_run.py
cat ~/day15/results.json | head -50"trt_version": "10.3.0" "ram_guard_mb": 7300 "tegrastats_sampling": true
- Script: tools/day15_build_vs_run.py
- Wrote: day15/results.json, vit_b_16_build.log, resnet50_build.log
- The script builds each engine with trtexec while it samples tegrastats RAM and the trtexec RSS every second, then loads each engine with the TensorRT Python API and runs 200 inferences.
# from day15/results.json and tools/day15_build_vs_run.py (this run)
"trt_version": "10.3.0", "ram_guard_mb": 7300
trtexec --fp16 --skipInference --memPoolSize=workspace:4096
MODELS: vit_b_16 (1, 3, 224, 224), resnet50 (1, 3, 480, 640)
run_inference: n=200, warmup=20
# board state captured 2026-09-29 (days/environment/board-2026-09-29.txt), not the state of this day's run
L4T R36.4.2, kernel 5.15.148-tegra
NV Power Mode: 15W
CUDA 12.6 (V12.6.68), TensorRT 10.3.0.30, cuDNN 9.3.0.75
The measurement
| What | Expected | Measured | Note |
|---|---|---|---|
| vit_b_16: build peak RAM / RSS | > runtime | 4370 / 3167 MB | ok |
| resnet50: build peak RAM / RSS | > runtime | 4241 / 2250 MB | ok |
| vit_b_16: runtime peak RAM / RSS / infer | - | 1665 / 787 MB / 9.99 ms | engine 175.7 MB, sha d5213a16a4f5 |
| resnet50: runtime peak RAM / RSS / infer | - | 2416 / 1172 MB / 12.72 ms | engine 51.9 MB, sha a660af6678de |
| RAM guard | - | 7300 MB | kills trtexec before the board thrashes |
| resnet50: build last RAM vs runtime peak RAM | different | 2416.0 / 2416.0 MB | identical: the runtime figure is the board RAM left after the build, not the engine's own cost |
| runtime RSS, vit vs resnet | bigger model uses more | 787.3 / 1171.8 MB | inverted 33%; RSS is the clean metric here |
Build tall, run short, one guard line
Line at guard 7300
Two rulers disagree (arithmetic)
board RAM minus process RSS:
vit build 4370 - 3167 = 1203 MB
resnet build 4241 - 2250 = 1991 MB
vit run 1665 - 787 = 878 MB
resnet run 2416 - 1172 = 1244 MB
vit build end: RSS 2620 > board RAM 1644
= the ruler fails: RSS and tegrastats do not line up
If the idle OS was the only item outside the process, these four values would be equal. They are not, and the ruler itself fails. At the end of the vit build the process RSS was 2620 MB while the whole board's used RAM was 1644 MB (results.json), which no subtraction can explain. The two samplers do not count the same pages at the same instant. tegrastatsNVIDIA's Jetson monitoring tool, which prints RAM, swap, CPU and GPU load, clock speeds, temperatures and power readings at a fixed interval. sees the GPU allocations in unified memoryThe CPU and GPU share one pool of physical DRAM, so every byte the GPU holds is a byte the operating system and CPU programs cannot use. and ps does not, so some of the spread is device memory. How much, this run cannot say.
| model | build RAM | build RSS | build s | run RAM | run RSS | infer ms |
|---|---|---|---|---|---|---|
| vit_b_16 | 4370 | 3167 | 89 | 1665 | 787 | 9.99 |
| resnet50 | 4241 | 2250 | 165 | 2416 | 1172 | 12.72 |
Where it broke
Prior 1 was incorrect on the low side. The build RSS was 3167 MB, which is below the 4096 workspace flag alone. The flag is a ceiling that the tacticOne candidate kernel implementation for a layer; the TensorRT builder times several tactics and keeps the fastest one that fits its memory limit. search can reach. It is not a demand. Board RAM had a peak of 4370, and 2930 remained below the guard.
Prior 2 was incorrect on the high side. The runtime RSS was 787 (vit) and 1172 (resnet50) against engines of 176 and 52 MB. Each process has six hundred to eleven hundred MB that is not weights. The smaller engine has more of it.
Prior 3 was incorrect because its input was incorrect. vit is faster, but resnet50 ran at 6.1x the pixels that I assumed. That is 50.2 GFLOP against 34.9 for vit. At the shape that the script used, flops predicted the order.
I almost gave the runtime RSS to the pie of Chapter 25. The arithmetic above shows that RSS does not show the device side. The pie gets the tegrastats delta, from idle to peak.
The runtime peak of resnet50, 2416 MB, is exactly the board RAM that remained when its build ended (last_ram_mb 2416 in results.json). That figure is build state plus the runtime, not the cost of the engine alone. The 751 MB over vit is therefore not a runtime comparison. The runtime RSS, 1172 against 787, is the only clean per-process figure here.
The shapes were in the script, and I did not read them. The batch is 1 for the two models. vit_b_16 used the input of the paper, and resnet50 used a camera-sized frame. My first flop/s for resnet50 used the shape of the paper and was incorrect by 6.1x.
Summary
- The builder had a peak of 3167 MB RSS with 172 MB of weights. Workspace is a ceiling that you set and then measure. It is not a demand.
- Build one time. Build on the board if the build fits, and in a different location if it does not. Commit the engine hash next to the TensorRT version. An engine is valid only for the exact TensorRT that built it.
- Board-wide RAM and process RSS answer different questions. RSS does not show the GPU allocations in unified memory. The budget of Chapter 25 gets the tegrastats delta, from idle to peak. I almost gave it the incorrect number.
Sources
These sources are not mine. Measured numbers came off my own board; specs, estimates and paper figures are labeled as such.
- TensorRT Edge-LLM docs: --externalize-weights int4_ffn for Orin Nano-class builds
- NVIDIA forum / issue threads on building on AGX and running on Nano
- TRT engine compatibility notes