The 8 GB Lab Book · Chapter 11
ONNX contracts and CUDA Graphs
- Board
- Jetson Orin Nano Super
- Mode
- 15W
- Setup
- TensorRT 10.3
- Summary
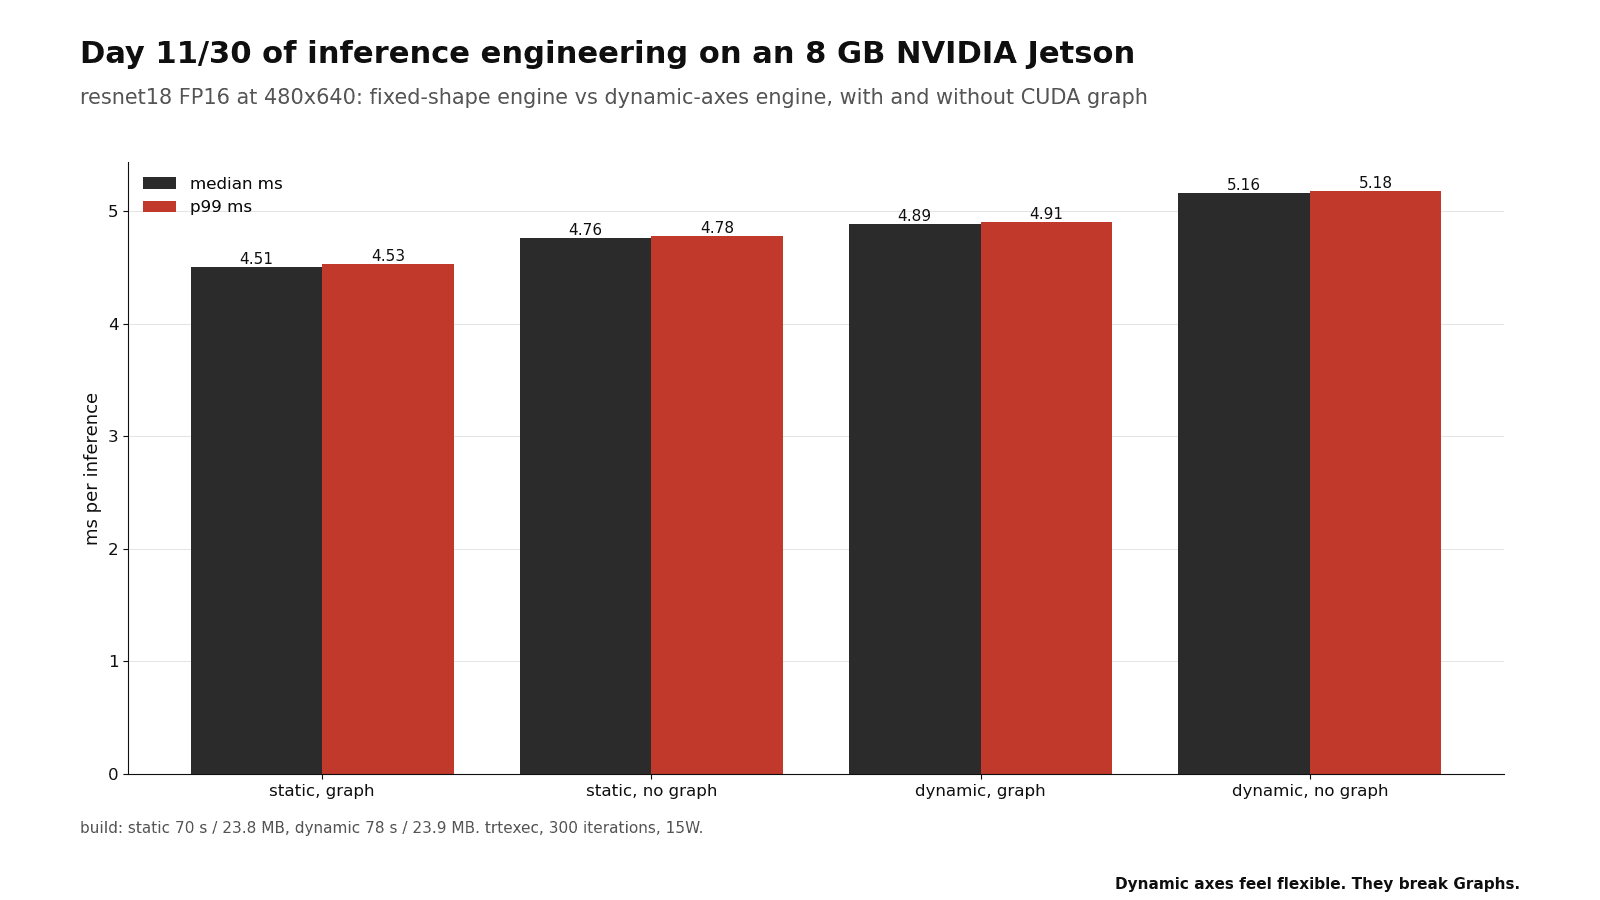
- Both engines captured a CUDA graph. The graph saved 0.25 ms on the static engine and 0.27 on the dynamic one. The dynamic engine still lost 0.38 ms, and the graph was not the cause.
What I expected
I expected that dynamic axes would cause a loss through the graph. Capture would fail, or the replay would have to resolve the shape again for each frame and lose most of its gain. I expected that the graph would save approximately one launch, 5 to 10 us. I forgot to multiply by the number of kernels in a network.
I expected almost the same build time and TensorRT engineThe compiled, GPU-specific plan TensorRT produces from a network; it has to be rebuilt for a different GPU or TensorRT version. size, because the weights are the same 23.4 MB in the two cases.
The theory
A 2x2 additive model, then a roofline for resnet18 at this shape
THE 2x2, MEDIANS (arithmetic on measured)
graph saves, static: 4.76 - 4.51 = 0.25 ms
graph saves, dynamic: 5.16 - 4.89 = 0.27 ms
dynamic costs, graph: 4.89 - 4.51 = 0.38 ms
dynamic costs, no graph: 5.16 - 4.76 = 0.40 ms
= interaction 0.02 ms: the two effects add
RESNET18 AT 480x640, FP16 (published counts + spec)
1.81 GMAC at 224x224 x 6.12 area = 11.1 GMAC
= 22 GFLOP per frame
tensor peak at 612 MHz: 32 TC x 512 x 0.612
  = 10 TFLOP/s (est.); floor 2.2 ms
weights 23.4 MB / 68 GB/s = 0.34 ms
= floor 2.2 ms; board 4.51: 49% of peak
The 0.25 ms of the graph over approximately 28 launches (resnet18 in TensorRTNVIDIA's inference compiler and runtime, which turns a trained network into an execution plan tuned for one specific GPU., estimate) is 9 us for each launch. That is the launch cost that Chapter 7 assumed. The dynamic tax is 17% of the compute floor. It pays for a 12x range of areas (720x1280 over 240x320) that one camera will never use.
The four medians (measured, 3 s timing trace per engine, 15W)
- static, graph
- 4.51 ms
- static, no graph
- 4.76
- dynamic, graph
- 4.89
- dynamic, no graph
- 5.16
The setup
python3 tools/day11_shapes.py
cat ~/day11/results.jsongrep -E 'GPU Compute Time|graph' ~/day11/static_graph.log | head
# median and percentile(99%) are the numbers; a CUDA graph warning means capture fell back"static": { "build_s": 70.5, "engine_mb": 23.8, "build_ok": true }
"dynamic": { "build_s": 78.2, "engine_mb": 23.9, "build_ok": true }
"contract": { "name": "tensor", "layout": "NCHW", "dtype": "FP16 in engine (FP32 ONNX)", "sha...- Script: tools/day11_shapes.py
- Wrote: day11/results.json
- And: four trtexec logs: static_graph, static_nograph, dynamic_graph, dynamic_nograph
- Every measured number on this page comes from these five files. The script exports resnet18 to ONNX, builds both engines with trtexec and times each with and without --useCudaGraph.
# from day11/static_graph.log (this run)
TensorRT version: 10.3.0
Selected Device: Orin
Compute Capability: 8.7
SMs: 8
trtexec --loadEngine=static.plan --fp16 --iterations=300 --warmUp=500 --useCudaGraph
# board state captured 2026-09-29 (days/environment/board-2026-09-29.txt), not the state of this day's run
L4T R36.4.2, kernel 5.15.148-tegra
NV Power Mode: 15W
CUDA 12.6 (V12.6.68), TensorRT 10.3.0.30, cuDNN 9.3.0.75
static_graph.log:    Timing trace has 666 queries over 3.01104 s
static_nograph.log:  Timing trace has 631 queries over 3.01251 s
dynamic_graph.log:   Timing trace has 615 queries over 3.01378 s
dynamic_nograph.log: Timing trace has 583 queries over 3.01483 s
The measurement
| What | Expected | Measured | Note |
|---|---|---|---|
| static build time / engine size | smaller, faster | 70 s / 23.8 MB | trtexec --fp16 |
| dynamic build time / engine size | bigger, slower | 78 s / 23.9 MB | profile 240x320..720x1280 |
| static infer median, graph / no graph | graph faster | 4.51 / 4.76 ms | capture ok |
| dynamic infer median, graph / no graph | - | 4.89 / 5.16 ms | capture ok |
| static p99, graph | - | 4.53 ms | 3 s trace |
| dynamic p99, graph | - | 4.91 ms | 3 s trace |
| Input contract | - | NCHW FP32 in and out, 1x3x480x640 RGB, FP16 inside | mean/std, bilinear half-pixel |
One contract, two sides, one gap
- Day 7 kernelemits f32 NCHW
- Tensor1x3x480x640 RGB
- Engine, FP16inside
- Logits1 x 1000
| what | my prior | the board |
|---|---|---|
| static build / engine | smaller, faster | 70 s / 23.8 MB |
| dynamic build / engine | bigger, slower | 78 s / 23.9 MB |
| static median, graph / no graph | graph faster | 4.51 / 4.76 ms |
| dynamic median, graph / no graph | capture fails | 4.89 / 5.16 ms, ok |
| static p99, graph | - | 4.53 ms |
| dynamic p99, graph | - | 4.91 ms |
| input contract | - | NCHW FP32 in and out, 1x3x480x640 RGB, FP16 inside |
Where it broke
I blamed the graph. Capture succeeded on the two engines. The replay saved 0.25 ms on the static engine and 0.27 on the dynamic engine. The graph was not what dynamic axes broke here. The opt point of the profile was 480x640, the exact shape that I ran, and the dynamic engine still lost 0.38 ms. My suspect is tacticOne candidate kernel implementation for a layer; the TensorRT builder times several tactics and keeps the fastest one that fits its memory limit. choice, because the tactics must be legal across the full range.
I guessed the saving of the graph and did not multiply by the kernel count. A launch is small, but resnet18 is approximately 28 launches (estimate). The multiplication is the full estimate, and I skipped it.
I wrote that the contract had a hidden cast and that no side owned it. The logs say otherwise. The build passed --fp16 and no --inputIOFormats, so the engine takes FP32Standard 32-bit floating point (single precision), the usual training format and the accuracy reference for lower-precision runs. in and gives FP32 out, and TensorRT casts to FP1616-bit floating point (half precision): half the bytes of FP32, and tensor cores run it at much higher throughput than FP32. inside the engine. Chapter 20 loaded static.plan and logged input=DataType.FLOAT. The contract is complete as written. The parity test on the real kernel output still has to run.
Summary
- The CUDA GraphA recorded sequence of GPU work that can be replayed with a single launch, which removes the CPU cost of launching each kernel separately. captured on the two engines. It saved 0.25 ms on the static engine and 0.27 on the dynamic engine. When the input shape did not change, dynamic axes did not break the graph.
- The dynamic engine cost 0.38 ms for each frame at the opt shape. The engine size almost did not change (23.8 against 23.9 MB). The build took 8 s longer.
- I first wrote that the contract lacked a cast line. It does not. The build has no --inputIOFormats, so the engine takes FP32 in and out and casts to FP16 inside, and Chapter 20 logged input=DataType.FLOAT for this engine.
Sources
These sources are not mine. Measured numbers came off my own board; specs, estimates and paper figures are labeled as such.
- TensorRT developer guide: optimization profiles, implicit vs explicit batch, CUDA Graph integration
- CUDA Graphs programming guide (capture restrictions: allocs, shape changes, certain host ops)