The 8 GB Lab Book · Chapter 20
The live pipeline exam
- Board
- Jetson Orin Nano Super
- Mode
- 15W
- Summary
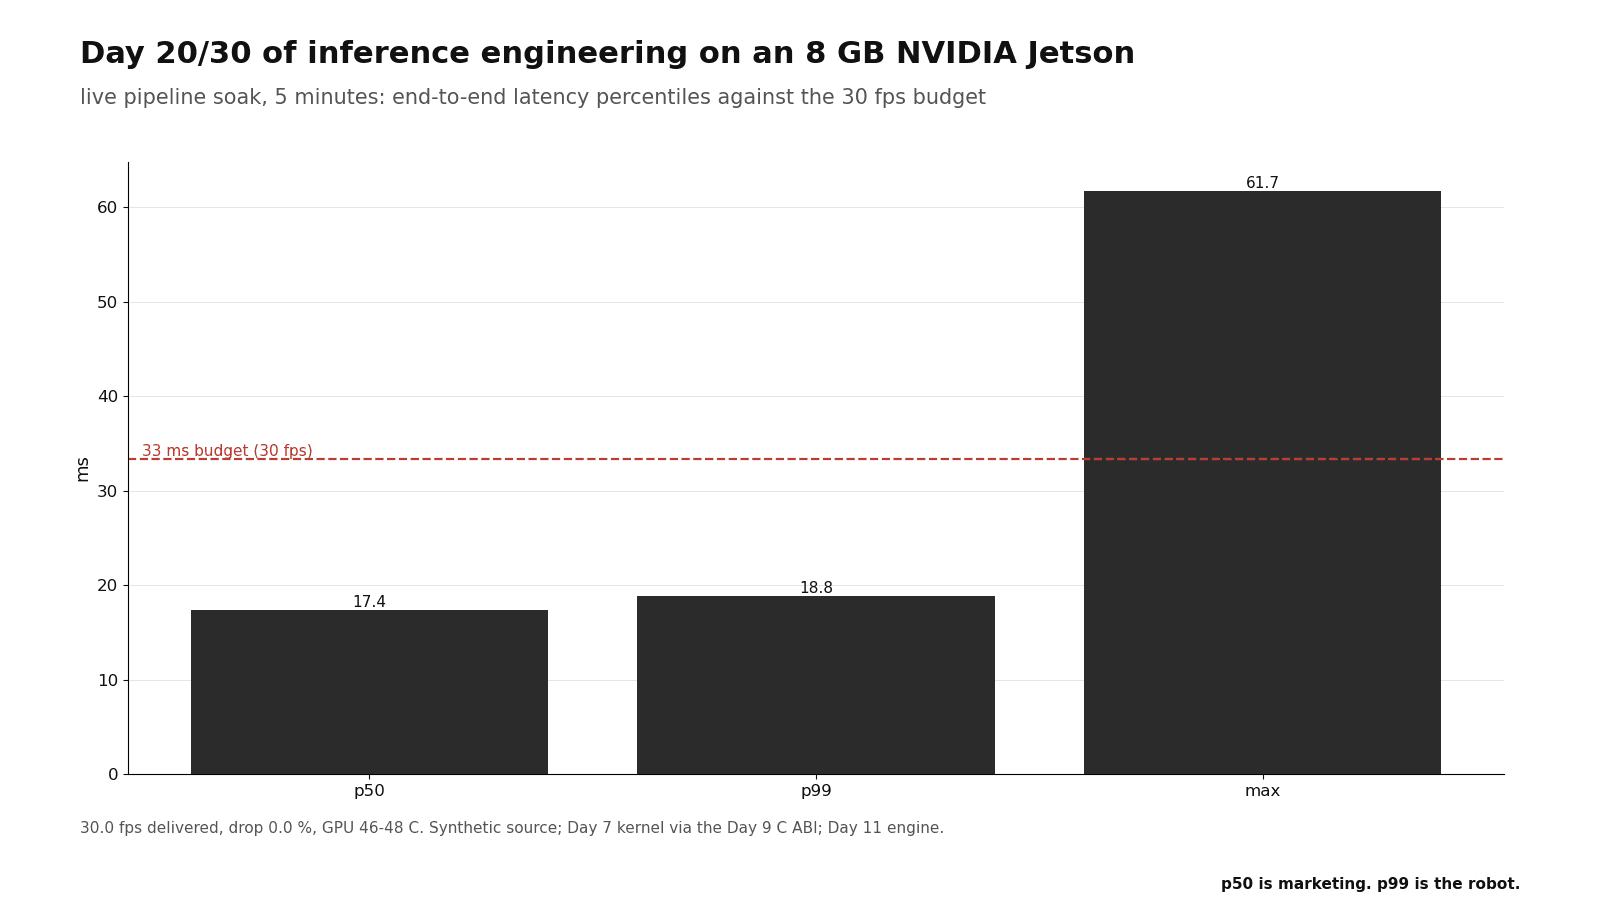
- p99 was 18.8 ms against a 33.3 ms period. Only the first two frames were late.
What I expected
I timed each stage alone on its own day. The sum was much less than one frame period. I wrote down 'p99The 99th-percentile latency: only one run in a hundred was slower, so it describes the tail a real-time loop has to survive. under 33 ms, 30 fps, zero drops'. I expected p99 to be near p50The median latency: half of the measured runs finished faster than this value and half slower. when nothing else ran.
I did not write a number for the maximum. This is the first thing to notice about my prior.
The theory
Little's law, and what a one-slot box can absorb
Little's law on the soak (arithmetic)
frames = 30 /s x 300 s = 9,000
in flight L = rate x latency
p50: 30 x 0.0174 s = 0.52 frames
p99 is 90 of those frames
= L < 1: the pipe is empty most of the time
What a one-slot box tolerates (theory)
source period T = 1000 / 30 = 33.3 ms
a stall drops a frame only if two
frames arrive while it lasts
so no drop while stall < 2T = 66.7 ms
max 61.7 sits 5 ms under that line
= one stall = two late frames, zero drops
The frame behind a 61.7 ms stall waited 61.7 - 33.3 = 28.4 ms in the box before its turn. That frame was also late. A rounded 0.0 % can hide up to 4 drops, because 9,000 x 0.05 % = 4.5. For this reason, the script also counts drops as integers.
FIFO VS MAILBOX BEHIND A MADE-UP 40 ms STAGE (theory)
- FIFO backlog
- +5 frames/s
- FIFO after 5 min
- 1,500 frames
- mailbox drop
- 17 %
The setup
python3 ~/day20_soak.py --minutes 5
cat ~/day20/results.json | head -30; head -5 ~/day20/timeseries.csv"meta": { "script": "day20_soak.py", "minutes": 5, "device": null, "timestamp": "2026-09-02T0...
"preprocess_backend_note": "using libfused.so at ~/day09/libfused.so (sw=1280 sh...
"inference_backend_note": "using TensorRT engine at ~/day11/static.plan (input=D...
"actual_duration_s": 300.152
"source_frames": 9001
"frames_inferred": 9001
"frames_with_latency": 9001
"mailbox1_dropped": 0
"mailbox2_dropped": 0
"total_dropped": 0The measurement
| What | Expected | Measured | Note |
|---|---|---|---|
| end to end p50 / p99 / max | < 33 ms p99 | 17.4 / 18.8 / 61.7 ms | 5 min soak |
| delivered fps / drop rate | 30 / 0 | 30.0 / 0.0 % | latest-wins mailboxes |
| GPU temp / power / RAM peak | - | 46-48 C / 4.6 W / 1985 MB | tegrastats 2 s |
Three threads, two boxes, frames on the floor are counted
- Source30 fps
- Boxlatest wins
- Preprocessfused kernel
- Boxlatest wins
- EngineTensorRT
Line at 33.3 ms, one period
| item | measured | tag |
|---|---|---|
| end to end p50 / p99 / max | 17.4 / 18.8 / 61.7 ms | * |
| delivered fps / drop rate | 30.0 / 0.0 % | * |
| frames over 33.3 ms | 2 (frames 0 and 1) | * |
| GPU temp / power / RAM peak | 46-48 C / 4.6 W / 1985 MB | * |
| real camera source | not measured yet | camera |
Where it broke
I predicted the p99 tail, and p99 agreed: 18.8 is 1.08x the p50. I did not predict the max tail. The max of 61.7 ms is 3.5x the p50 and 1.9x the budget. It is frame 0, and frame 1 took 45 ms after it. timeseries.csv shows no other frame over 33.3 ms, and the worst of the other frames was under 30 ms.
The p50 is at half the period, so the GPU idles approximately half the time. The GR3D median of 43 % agrees. The 61.7 ms occurred at the start, not in the middle of the run. The script has no warm-up pass, so frame 0 carries all first-call costs.
I predicted p99 and fps, and I forgot max. Five minutes is 9,000 frames, so p99 is 90 frames and max is one frame. A control HzHow often the low-level control loop reads sensors and updates motor commands; it normally runs much faster than the policy above it. needs the number of frames that crossed 33.3 ms. timeseries.csv logs each frame, and 2 frames crossed: frames 0 and 1.
The integer counters mailbox1_dropped and mailbox2_dropped are 0. 9001 frames went in, and the TensorRT engineThe compiled, GPU-specific plan TensorRT produces from a network; it has to be rebuilt for a different GPU or TensorRT version. processed 9001.
The source was a timer, and results.json records device: null. The timer posts on time, so this p99 is the p99 of the pipeline alone. A USB camera adds the jitter of its driver before my first thread runs.
Summary
- p99 was 18.8 ms. This is 1.08x the p50 and much less than the 33.3 ms period. Only the first two frames took more than one period. That was a cold start, not a stall in the middle of the run.
- Two latest-wins mailboxes dropped 0 of 9001 frames at 30 fps. In theory, a FIFO turns a slow stage into age. A mailbox turns it into a drop count that I can read.
- Over the five-minute soak, the GPU temperature increased by 1.7 C, from 46 to 48 C. Board RAM had a peak of 1985 MB.
Sources
These sources are not mine. Measured numbers came off my own board; specs, estimates and paper figures are labeled as such.
- Real-time systems 101 (mailbox vs queue)
- Days 7, 16, 17, 18 of this book
- Jetson thermal behavior under sustained 30 Hz + GPU