The 8 GB Lab Book · Chapter 22
Prefill, decode, and the wrong headline
- Board
- Jetson Orin Nano Super
- Mode
- 15W
- Summary
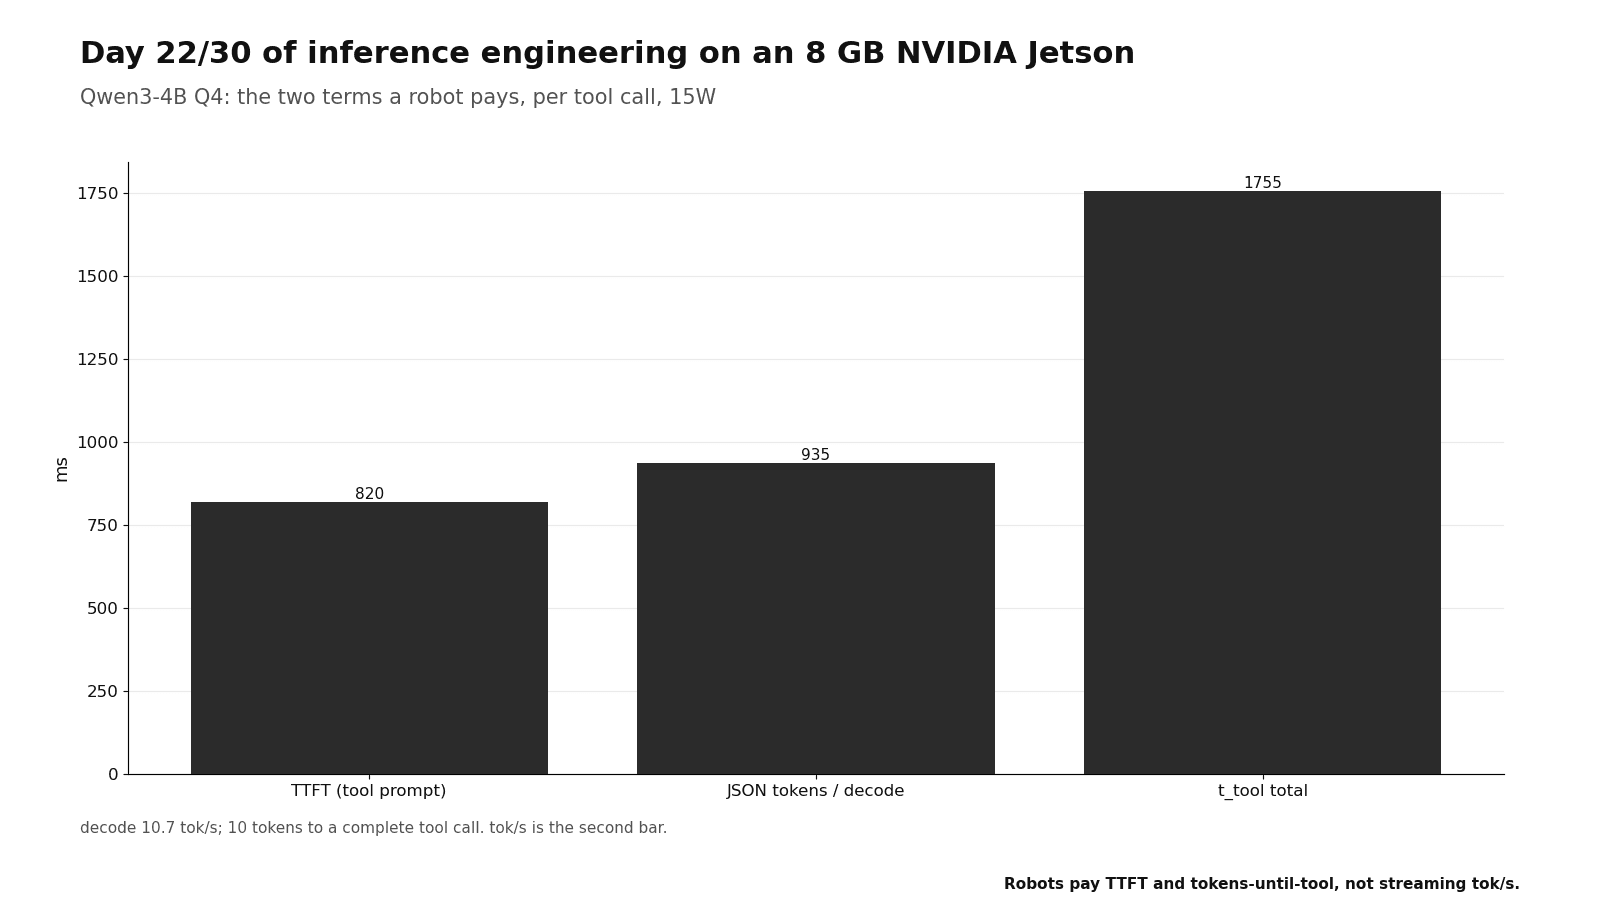
- One Qwen3-4B tool call took 2,061 ms on the board, the median of five, and three reruns on 2026-10-04 gave 2,070 / 2,061 / 2,066 ms (15 calls, p10 1,431, p90 4,076): 796 ms to the first token, then 1,265 ms for 10 JSON tokens at 7.1 tok/s on that call. The 1,755 ms I first printed was arithmetic at the chat decode rate. By subtraction, about 658 ms of the 820 ms median TTFT is the fixed schema.
What I expected
I wrote down 20 to 40 tokens for a tool call. I expected that the decodeThe phase after prefill where a language model generates one token at a time and re-reads its weights for each one; it is usually limited by memory bandwidth. term would be most of the wait. 30 tokens at 10.7 tok/sTokens per second: how fast a language model reads a prompt (prefill) or writes output (decode); the two rates are different numbers. is 2.8 s, and I imagined a prefillThe first phase of language-model inference, where the whole prompt is processed in one parallel pass to fill the KV cache; it is usually limited by compute. of a few hundred ms. I expected that decode would be the term to attack.
I expected that the TTFTTime to first token: the delay between sending a request and receiving the first generated token, mostly spent in prefill. of the tool prompt would be higher than the TTFT of chat. I did not write a number for the difference.
The theory
Two terms, and they live on opposite sides of the ridge
Prefill side (estimate)
4 B params x 2 flop = 8 GFLOP per token
fp32 peak 1.25 TFLOP/s: 6.4 ms per token
820 - 162 = 658 ms extra for the schema
658 / 6.4 = about 103 schema tokens
AI = 100 tok x 2 flop / 0.6 B per weight = 333 flop per byte
= 333 >> ridge 18: compute side
Decode side (arithmetic, chat rate)
1 / 10.7 tok/s = 93.5 ms per token (chat)
weights 4 B x 4.9 bit / 8 = 2.45 GB (est.)
2.45 GB / 93.5 ms = 26 GB/s moved
Day 2's SLM pull: 28 GB/s. same place
AI = 2 flop / 0.6 B = 3.3 flop per byte
= 3.3 << ridge 18: memory side
One tool call reads the full model again ten times: 10 x 2.45 GB = 24.5 GB of DRAM traffic for approximately forty characters of JSON. The roof at 68 GB/s would give 36 ms per token, which is 28 tok/s. The board runs at 2.6x that floor.
WHAT EACH ATTACK REMOVES FROM THE MEASURED 2,061 ms (arithmetic)
- cache the prefix
- -658 ms
- halve the JSON
- -632 ms
- decode 2x faster
- -632 ms
The setup
python3 -c "import json;s=json.load(open('$HOME/slm/qwen3-4b.json'));print([round(c['ttft_ms']) for c in s['chat']],[round(t['ttft_ms']) for t in s['tool']],[t['tokens'] for t in s['tool']])"~/llama.cpp/build/bin/llama-server -m ~/models/X.gguf -ngl 99 -c 4096 --port 8080 --cache-prompt # then send the same system prompt twice and compare TTFTThe measurement
| What | Expected | Measured | Note | Rerun 2026-10-04, n=3 (15 calls) |
|---|---|---|---|---|
| Qwen3-4B Q4: TTFT chat, no image | - | 162 ms | median of 5 | 162 ms, p10 137, p90 177 |
| TTFT tool prompts (schema in system) | higher | 820 ms | median of 5 | 820 ms, p10 797, p90 1,639 |
| decode tok/s, chat | - | 10.7 | median of 5 | 10.7, p10 9.9, p90 11.0 |
| decode tok/s, during a tool call | - | 6.0 | median of 5, 1.6 to 7.2 | 6.0, p10 1.6, p90 7.1 |
| tokens until tool call complete | ~20-40 | 10 | median of 5 | 10, p10 2, p90 19; 15 of 15 returned a tool_call |
| t_tool, end to end | 1755 ms (arithmetic at the chat rate) | 2061 ms | median of 5: 3172 / 1813 / 2061 / 1432 / 4071 | 2,066 ms, p10 1,431, p90 4,076; run medians 2,070 / 2,061 / 2,066 |
The clock: a shaded prefill, then ten ticks
- Same schemaevery call
- Cache its KVa server flag
- Prefill onlythe user turn
- TTFT to ~162prediction
| term | measured | tag |
|---|---|---|
| TTFT, chat prompt, no image | 162 ms | * median of 5 |
| TTFT, tool prompt, schema in system | 820 ms | * median of 5 |
| TTFT with the robot-default image | not measured yet | Day 19 VLM |
| decode, chat | 10.7 tok/s | * median of 5 |
| decode, during a tool call | 6.0 tok/s | * median of 5 |
| tokens until the tool call is complete | 10 | * median of 5 |
| t_tool = TTFT + tokens / chat decode | 1755 ms | arithmetic |
| t_tool, end to end | 2061 ms | * median of 5, the robot's |
| t_tool, rerun 2026-10-04, 3 runs of 5 | 2,066 ms | * median of 15, p10 1,431, p90 4,076; 15 valid tool calls |
Where it broke
The JSON is 10 tokens, not 30. I imagined pretty-printed JSON with spaces and newlines. The tokenizer reads a one-line object as ten pieces. So decode is about 1.3 s, not 2.8 s. On the median call the split was 796 ms of prefill and 1,265 ms of decode, 39 and 61 percent.
I first printed t_tool as 820 + 10 x 93.5 = 1,755 ms, with the chat decode rate, and tagged it measured. The log has the five totals: 3,172 / 1,813 / 2,061 / 1,432 / 4,071 ms, median 2,061. Decode during a tool call ran at 6.0 tok/s, median, not the chat's 10.7. Most likely the server's tool-call parsing per token; not tested. On 2026-10-04 I ran the same harness three more times: the run medians were 2,070, 2,061 and 2,066 ms, each prompt within 10 ms of its first time, 15 of 15 calls a valid tool_call, TTFT median 820 ms and decode 6.0 tok/s during the calls. The spread on this page is between prompts, not between runs.
The schema costs 4x the chat prefill: 658 / 162 = 4.1x, and the whole tool prefill is 5.1x. That is 658 ms for each call, for bytes that never change. That term has a free fix, so prefill is the first target.
My prior for the JSON was 3x too long, because I never tokenized the target.
Summary
- tok/s is not what the robot waits for. The robot waits for TTFT plus the tokens until the tool call is complete. A model can stream prose at 30 tok/s and take 900 ms to start. For the robot, it is slower than a model at 15 tok/s that starts in 200.
- Vision tokens are prefill tokens. An attached image has the same cost as a long pasted prompt. Chapter 19 measures exactly how long.
- The JSON was 10 tokens, not the 20 to 40 that I guessed. It still cost 1,265 ms on the median call, 61 percent of it. The schema's 658 ms of prefill repeats on each call, and that repetition is why I attack it first.
Sources
These sources are not mine. Measured numbers came off my own board; specs, estimates and paper figures are labeled as such.
- Standard LLM serving literature (prefill vs decode)
- Edge-LLM features: speculative / EAGLE3 rows in the Nano table
- Your Day 2 roofline
- day22/rerun-2026-10-04/summary.json: slm_eval.py run three more times on 2026-10-04 (rerun1004-day22-run1..3.json, tegrastats beside each)