The 8 GB Lab Book · Chapter 9
Rust as host, CUDA as device
- Board
- Jetson Orin Nano Super
- Mode
- 15W
- Setup
- CUDA 12.6 · rustc 1.98
- Summary
- Same fused kernel, two hosts, a pageable copy inside the timed loop. Rust's tight-loop p50 was 967 us against 1777 us for Python. In the paced 30 Hz loop the same calls took 4284 us in Rust against 2327 us in Python. Rust's worst tick was 1168 us late against 40 us. The Rust host reached its first kernel in 94 ms against 294 ms. Three reruns on 2026-10-04: tight p50 962 to 995 us Rust against 1,593 to 1,660 Python; paced work 4,102 to 4,295 against 2,394 to 2,418 us, 1.7x to 1.8x; Rust's worst tick 0.5, 0.5 and 31 us, so the 1168 did not repeat.
What I expected
My prediction was the same p50The median latency: half of the measured runs finished faster than this value and half slower. for the two hosts. The GPU does the same 206 us of work (Chapter 7), and two foreign calls cost single-digit microseconds. I wrote 'same p50, different tail' before I ran anything. I expected that Python would have the spiky tail because of the GIL and the collector.
I expected that the worst tick of Rust would be its p99The 99th-percentile latency: only one run in a hundred was slower, so it describes the tail a real-time loop has to survive. plus a small quantity. I did not expect that the scheduler would give the largest number on the page.
The theory
A floor for the timed region, then the pacer's arithmetic
Timed region, per frame (arithmetic)
kernel alone: 0.206 ms (Day 7)
DMA of 2.76 MB at 18 GB/s (Day 8): 0.15 ms
pageable source: CPU memcpy to staging first,
  2.76 MB at 5 to 10 GB/s (est.) = 0.3 to 0.55 ms
sync + 2 foreign calls: ~10 us (est.)
= floor 0.67 to 0.92 ms
THE PACER AT 30 Hz
period = 33,333 us
work measured: 2327 us Python, 4284 us Rust (mean)
so sleep ~29 to 31 ms per tick
spin tail 0.5 ms x 30 = 15 ms per s
= 1.5% of a core, burned on purpose
late only if sleep wakes > 0.5 ms after asked
The p50 of Rust (967 us) is 5% above the top of the floor. The p50 of Python (1777 us) is the floor plus 0.8 ms, and two ctypes calls cannot explain that difference. The bracket contains a copy from pageable memory: a CPU memcpy into a staging buffer, then the DMA. The frame allocation is outside the bracket in both hosts.
The paced loop did not agree with the tight loop. Inside a 30 Hz tick, the same two calls took 4284 us in Rust and 2327 us in Python, a mean over 600 ticks. Rust was 1.8x slower there and 1.8x faster in the tight loop. Same kernel, same calls. Most likely the state after a 30 ms sleep, cache or CPU clock; not tested. Three reruns on 2026-10-04 gave the same order: 4,102 to 4,295 us Rust, 2,394 to 2,418 Python.
TAILS, p99 MINUS p50, AND THE WORST TICK (arithmetic on measured)
- Python tight
- 349 us
- Rust tight
- 984 us
- Python worst tick
- 40 us
- Rust worst tick
- 1168 us
The setup
cd jetson-8gb-kernels/day09 && export PATH=/usr/local/cuda/bin:$HOME/.cargo/bin:$PATH && bash run.sh
# builds libfused.so (nvcc) and host_rs (cargo), runs host_py.py and host_rs, writes results.json, runs parity.py
cat results.jsonldd host_rs/target/release/host_rs | grep -E 'python|fused|cudart'"python": { "host": "python", "startup_ms": 294.369 }
"rust": { "host": "rust", "startup_ms": 94.46 }
"rust_binary_bytes": 509704
"ldd_libpython": ""
"parity_max_abs_diff": "0.000000 (PASS)"Environment and script
- Script: jetson-8gb-kernels/day09/run.sh (shim.cu, host_py.py, host_rs, parity.py). Output: results.json.
- Board: Orin Nano Super, 15W (measured.json). Clocks not logged.
- Toolchain: CUDA 12.6, nvcc -arch=sm_87, rustc 1.98.
- Scheduler: stock Linux, no real-time priority, no chrt.
The measurement
| What | Expected | Measured | Note |
|---|---|---|---|
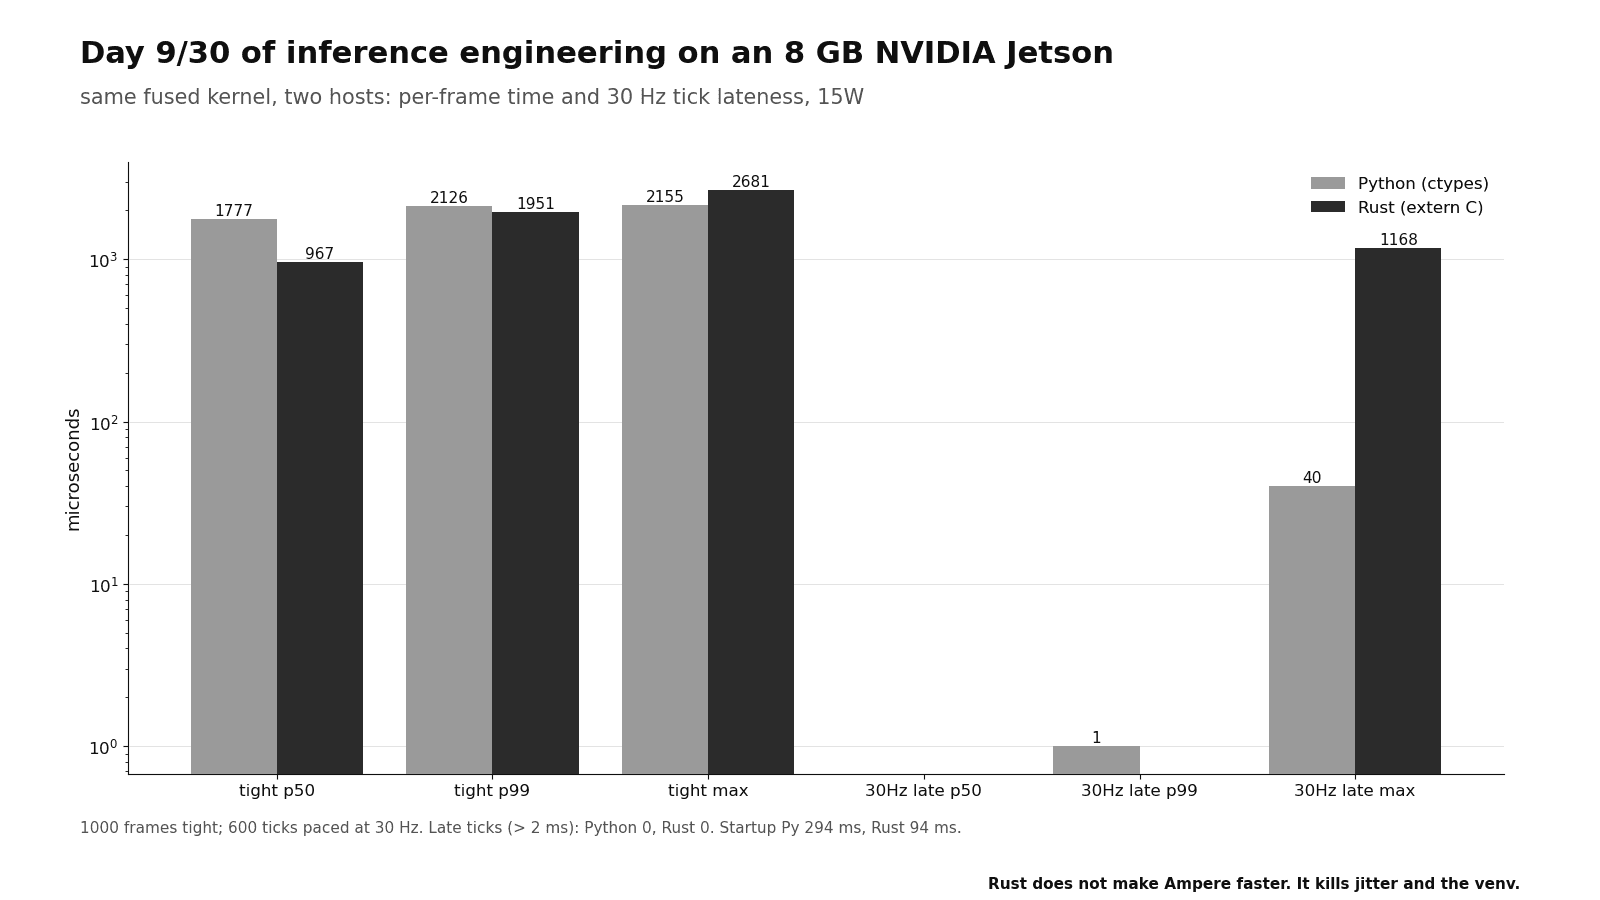
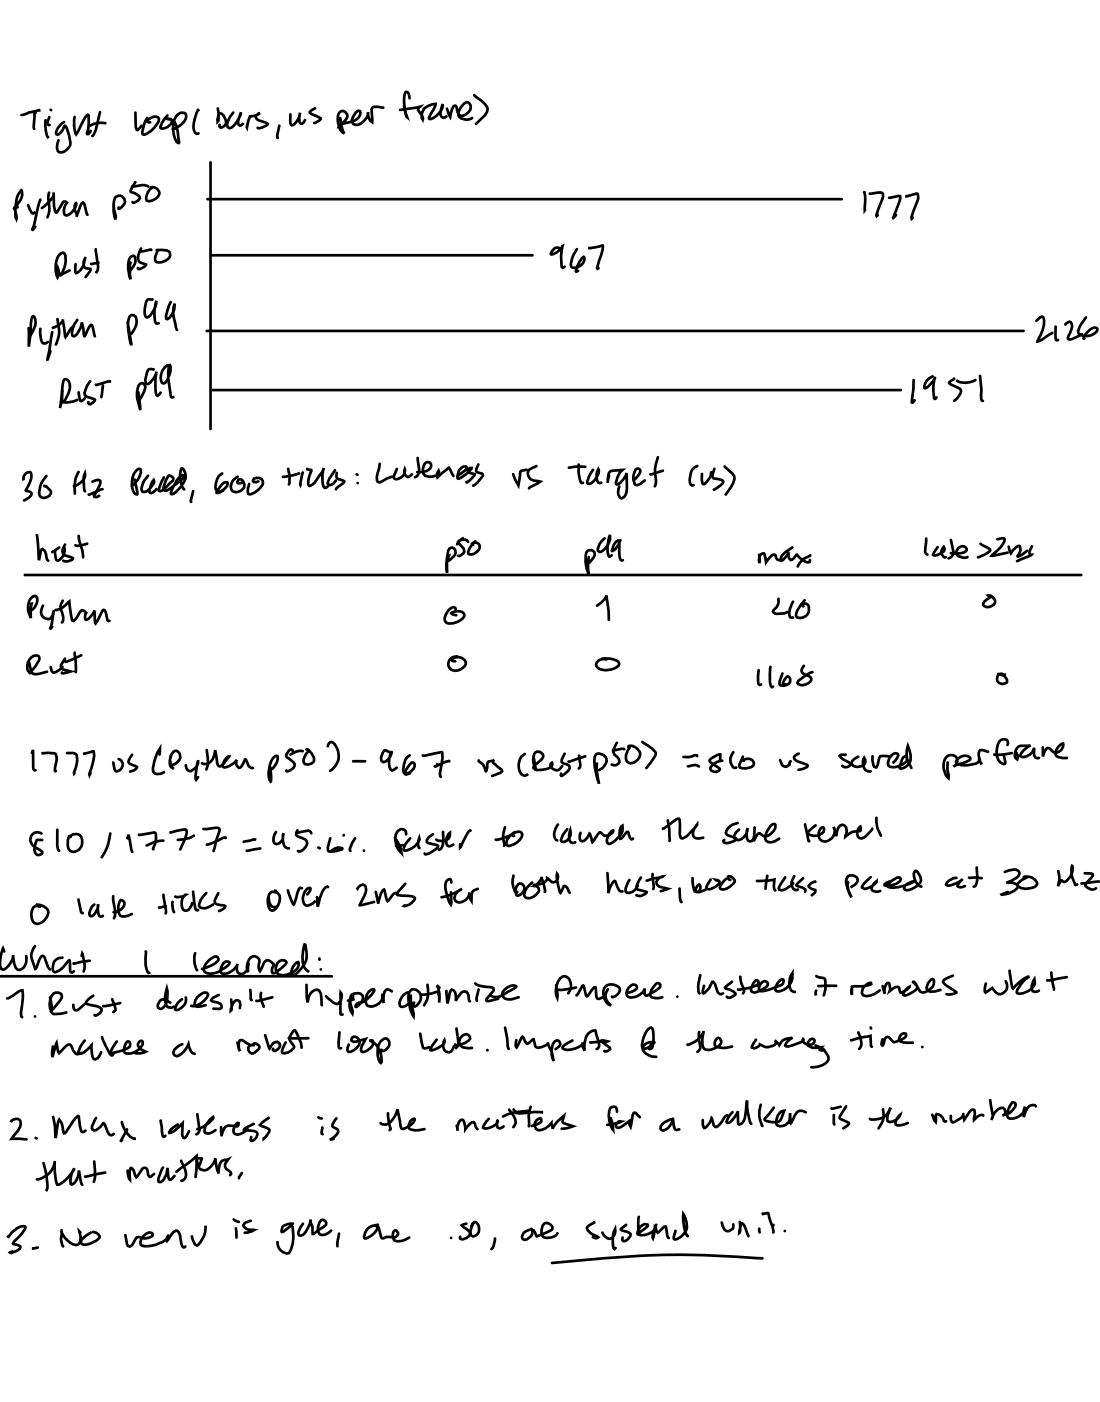
| tight loop p50 / p99 / max, Python | - | 1777 / 2126 / 2155 us | ctypes, 1000 frames |
| tight loop p50 / p99 / max, Rust | same p50 | 967 / 1951 / 2681 us | extern C, no crates |
| 30 Hz tick lateness p50 / p99 / max, Python | spiky | 0 / 1 / 40 us | 0 ticks > 2 ms |
| 30 Hz tick lateness p50 / p99 / max, Rust | smooth | 0 / 0 / 1168 us | 0 ticks > 2 ms |
| 30 Hz work inside the tick, mean, Python / Rust | same | 2327 / 4284 us | upload + run inside the paced tick; Rust 1.8x slower |
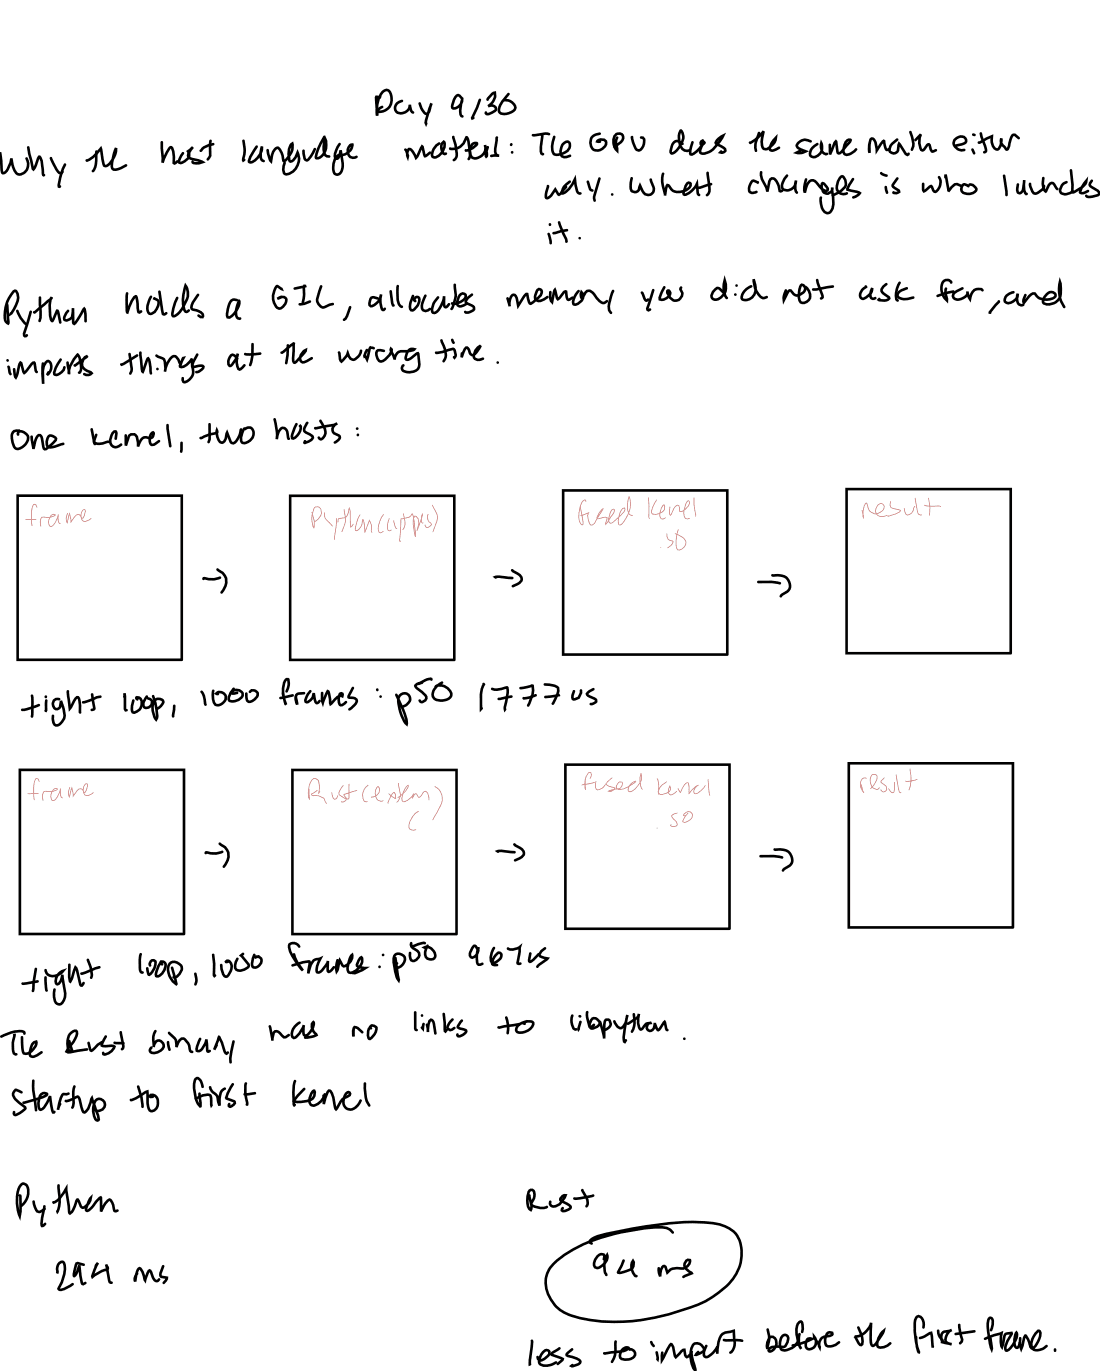
| startup to first kernel | Rust faster | Py 294 ms / Rust 94 ms | |
| Rust binary size / libpython | small / none | 0.51 MB / none | ldd |
| parity vs Day 7 reference | 0 | 0.000000 (PASS) | same kernel |
| Rerun 2026-10-04, tight loop p50 / p99, Python, n=3 | - | 1,622 / 1,851 us | p50 1,593 to 1,660; p99 1,816 to 1,899 |
| Rerun 2026-10-04, tight loop p50 / p99, Rust, n=3 | - | 984 / 2,143 us | p50 962 to 995; p99 2,138 to 2,168, wider than Python in each run |
| Rerun 2026-10-04, 30 Hz work inside the tick, Python / Rust, n=3 | - | 2,397 / 4,250 us | Python 2,394 to 2,418; Rust 4,102 to 4,295; 1.7x to 1.8x |
| Rerun 2026-10-04, worst tick lateness, Python / Rust, n=3 | - | 11 to 12 us / 0.5, 0.5, 31 us | the 1168 us did not repeat; 0 ticks over 2 ms in all six loops |
What sits inside the clock, in either host
- Fresh frame2.76 MB pageable
- CPU memcpyto staging
- DMA to GPU18 GB/s
- Kernel 206 us+ stream sync
| what | my prior | the board |
|---|---|---|
| tight loop p50 / p99 / max, Python | - | 1777 / 2126 / 2155 us |
| tight loop p50 / p99 / max, Rust | same p50 | 967 / 1951 / 2681 us |
| 30 Hz lateness p50 / p99 / max, Python | spiky | 0 / 1 / 40 us |
| 30 Hz lateness p50 / p99 / max, Rust | smooth | 0 / 0 / 1168 us |
| 30 Hz work inside the tick, mean, Py / Rust | same | 2327 / 4284 us |
| ticks over 2 ms, either host | - | 0 |
| startup to first kernel, Py / Rust | Rust faster | 294 / 94 ms |
| Rust binary / links libpython | small / no | 0.51 MB / no |
| parity vs Day 7 reference | 0 | 0.000000 PASS |
| rerun 2026-10-04, tight p50 / p99, Python / Rust, n=3 | - | 1,622 / 1,851 vs 984 / 2,143 us |
| rerun 2026-10-04, 30 Hz work inside the tick, Py / Rust, n=3 | same | 2,397 / 4,250 us |
| rerun 2026-10-04, worst tick, Py / Rust, n=3 | - | 11 to 12 / 0.5, 0.5, 31 us |
Where it broke
The p50 values were not equal. 810 us is too large for two foreign calls. cudaMemcpyAsync from pageable memory is a CPU memcpy into a staging buffer before the DMA, and that copy is inside the bracket. The allocation of each 2.76 MB frame is outside it: make_frame runs before the timer in both hosts. My suspect, not measured: the numpy frame leaves the cache before the clock starts, so the staging memcpy reads from DRAM in Python and from cache in Rust.
The paced loop then reversed the order. Inside a 30 Hz tick the same calls took 4284 us in Rust and 2327 us in Python. A result that flips with the loop shape is not a language result. I did not isolate it. Three reruns on 2026-10-04 repeated the flip: 4,102 to 4,295 us Rust against 2,394 to 2,418 Python inside the tick, 962 to 995 against 1,593 to 1,660 in the tight loop.
The tail went in the opposite direction. The tight-loop tail of Rust is 2.8x wider. In one run of 600 ticks for each host, its worst tick is 29x later. 'Smooth vs spiky' was an explanation that I wanted, not a result. In the 2026-10-04 reruns Rust's p99 stayed at 2,138 to 2,168 us and its worst tick fell to 0.5, 0.5 and 31 us.
My aim was to measure a language, but my bracket contained a pageable copy. The first item inside the clock must be the item under test. A pinned memoryHost memory that the operating system is not allowed to page out, which lets the GPU's copy engine transfer to and from it directly and asynchronously. (cudaHostAlloc) in the two hosts would take the copy out of the bracket.
The advantage that stays is operational: 94 ms to first kernel, 0.51 MB, no libpython, no venv. That is a sufficient reason to keep the Rust host.
My notes from Day 9
Written by hand on 2026-09-09, before this chapter was typed. These are my original notes from that day. Where the chapter corrects them, the chapter is current.
Summary
- Rust does not make Ampere faster. With a pageable copy inside the timed loop, the p50 of Rust was 967 us against 1777 us for Python. Two foreign calls cannot explain the 810 us gap.
- The paced loop reversed the tight loop. Inside a 30 Hz tick the same upload and run took 4284 us in Rust and 2327 us in Python, 1.8x slower in Rust. I have not isolated the cause. Three reruns on 2026-10-04 repeated it: 4,102 to 4,295 us against 2,394 to 2,418, 1.7x to 1.8x.
- For a walker, the important number is the max lateness, not the mean. With the stock Linux scheduler and no real-time priority, the worst tick of Rust was 1168 us against 40 us for Python. In three reruns on 2026-10-04 Rust's worst tick was 0.5, 0.5 and 31 us: the 1168 us did not repeat.
- There is no venv now. There is one binary and one .so. That is an operational advantage, also on the days when the timing shows a tie.
Sources
These sources are not mine. Measured numbers came off my own board; specs, estimates and paper figures are labeled as such.
- cudarc docs (driver API from Rust)
- CubeCL / kornia-rs Jetson GSoC 2026 (GPU preprocess for VLMs on Nano)
- CUDA-Oxide, an experimental Rust-to-PTX path (not used here)
- day09/rerun-2026-10-04/summary.json: day09/run.sh three times on 2026-10-04 (results_run1..3.json, tegrastats beside each)