The 8 GB Lab Book · Chapter 18
Detectors under a RAM cap
- Board
- Jetson Orin Nano Super
- Mode
- 15W
- Summary
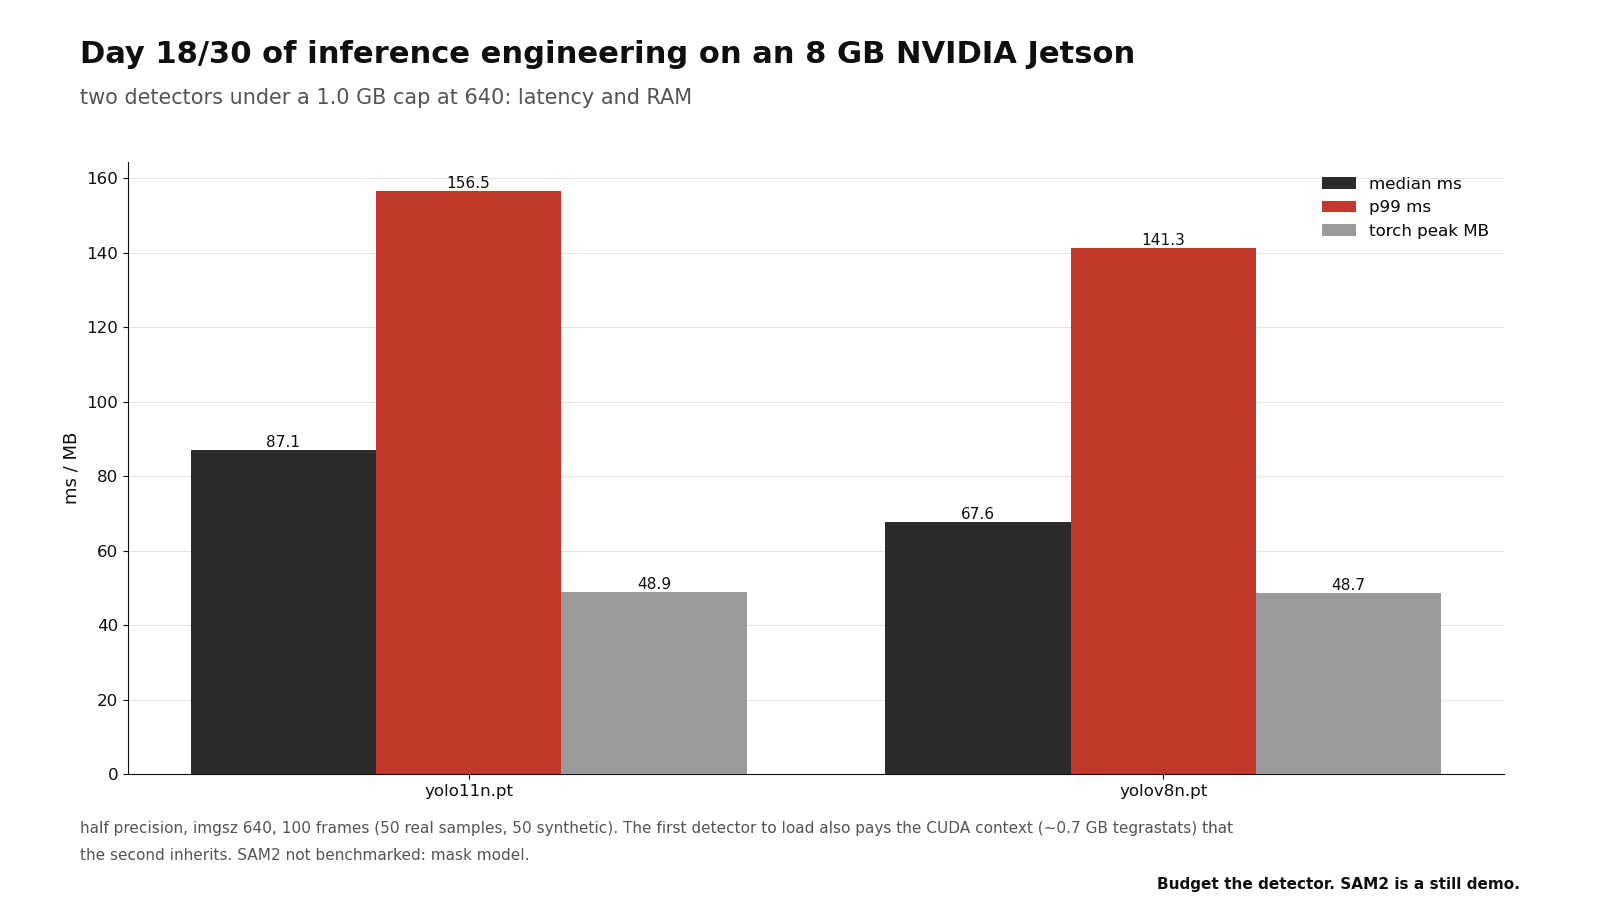
- yolo11n ran 19.5 ms slower than yolov8n with fewer flops. The first detector cost 732 MB of RAM, the second 12.
What I expected
A nano detector at 640 is 8.7 GFLOP (nameplate). For Prior 1, I used the conv rate of Chapter 15, 0.64 TFLOP/s, and got 14 ms. Multiplied by the eager overhead of Chapter 17, 6x, that is approximately 80. I expected 60 to 90 ms for yolov8n. I expected less for yolo11n, because it has fewer flops.
Prior 2 was that the memory is similar to Chapter 17. The weights are 5 to 6 MB, the activations are possibly 50 and a context is near 200. I used 300 MB for each detector as the estimate. The two detectors fit below the cap, and the second detector costs 300 more.
Prior 3 was that the tails are within 20 percent of the median, as the pipes of Chapter 16 were.
The theory
Flops against modules; then what the cap actually measures
Flops say one thing (nameplate)
yolov8n: 8.7 GFLOP, 3.2 M params
yolo11n: 6.5 GFLOP, 2.6 M params
at 0.64 TFLOP/s: 14 and 10 ms
measured: 67.6 and 87.1 ms
= achieved 0.13 and 0.075 TFLOP/s
Modules say another (est.)
fused layers: v8n ~170, 11n ~240
  (ultralytics summaries, est.)
67.6 / 170 = 0.40 ms per layer
87.1 / 240 = 0.36 ms per layer
flops fell 25%, time rose 29%
= 0.4 ms a module, whatever it computes
The two nets here have only small kernels. The net with more modules is slower, although it has fewer flops. The median also includes the letterbox and NMS of ultralytics.
What the cap was judging (MB, measured unless marked)
- weights, v8n
- 6.4 (arith.)
- torch peak
- 49
- first load, tegra
- 732
- second load
- 12
The setup
python3 ~/day18_detect.py --cap-gb 1.0 --r-min 640
cat ~/day18/results.json | head -40"script": "day18_detect"
"cap_gb": 1
"r_min": 640
"sam2_note": "not benchmarked; mask model, not a box model"
"frame_set": { "real": 50, "synthetic": 50, "total": 100 }The measurement
| What | Expected | Measured | Note |
|---|---|---|---|
| cap / r_min | - | 1.0 GB / 640 | written before download |
| yolo11n.pt: median / p99 ms | - | 87.1 / 156.5 | torch peak 49 MB, PASS |
| yolov8n.pt: median / p99 ms | - | 67.6 / 141.3 | torch peak 49 MB, PASS |
| SAM2 | - | not benchmarked | mask model, not a box model |
One glance, serial, with the 30 fps line through it
- camera P3 4.69 ms (Day 16)
- embedding 14.7 ms (Day 17)
- detector v8n 67.6 ms (today, median)
Line at 30 fps: 33.3 ms
| detector | median ms | p99 ms | torch pk MB | tegra MB | verdict |
|---|---|---|---|---|---|
| yolo11n.pt | 87.1 | 156.5 | 49 | 732 | PASS |
| yolov8n.pt | 67.6 | 141.3 | 49 | 12 | PASS |
| SAM2 | - | - | - | - | not run |
p99 OF 100 FRAMES (arithmetic)
1% of 100 frames = 1 frame: p99 is the worst one or two
tails: 156.5 - 87.1 = 69; 141.3 - 67.6 = 74 ms
the 50 real frames are 2 images, bus.jpg and zidane.jpg, 25 times each
= an anecdote until n is near 1000
A tail as large as the median means that one frame in fifty takes a slow branch. The branch can be a letterbox to a new size, an allocator refill or a new cuDNN plan. A per-frame log with the input shape next to the ms would name it.
Where it broke
For Prior 1, the v8n number was correct (67.6, inside my 60 to 90), but the order was the opposite. 11n, with fewer flops, is 19.5 ms slower. Flops predicted the wrong sign. The module count (est.) gives the right sign. My range used the 0.64 TFLOP/s of Chapter 15. Chapter 15 now shows a shape error in that number, so the hit was partly luck.
For Prior 2, 300 for each detector became 732, then 12. The context and the imports are 3.5x the 191 MB of Chapter 17. The second model cost almost nothing. The cap is on a process, and a process pays for its runtime one time.
For Prior 3, the tails were 69 and 74 ms, which is 80 and 109 percent of their medians. The NVMMNVIDIA's hardware-accessible frame buffers on Jetson, allocated in the same system DRAM as everything else, so the camera, converter and encoder can pass frames along without a CPU copy. pipes of Chapter 16 had 7 to 13 percent.
I predicted the order from flops, and the sign was wrong. At batch 1, a module costs approximately 0.4 ms (est.), whatever it computes. For these two small nets, the module count predicted the order and flops did not.
1.0 GB against a 49 MB model is a cap on the runtime, not on the detector. The next cap has two lines: the first model in the process, and each additional model. The context was 683 MB here and 191 MB on Chapter 17. My guess is cuDNN (est.). An import-only run would measure it.
Summary
- Write the cap first. The cap changes "which detector is best" into "which detector passes". That question has a measurement as its answer.
- Over 100 frames, p99 is the worst one or two frames. It sat 69 ms above the median for yolo11n and 74 ms above it for yolov8n.
- The first detector raised board RAM by 732 MB, and the second by 12 MB. 683 MB of the first load was the runtime, not the model.
Sources
These sources are not mine. Measured numbers came off my own board; specs, estimates and paper figures are labeled as such.
- Jetson AI Lab: SAM2-base and Grounding DINO fps on Nano Super (few fps class)
- YOLO-family TRT recipes on Jetson
- Your Day 5 budget