The 8 GB Lab Book · Chapter 24
Serving shape: process, not notebook
- Board
- Jetson Orin Nano Super
- Mode
- 15W
- Summary
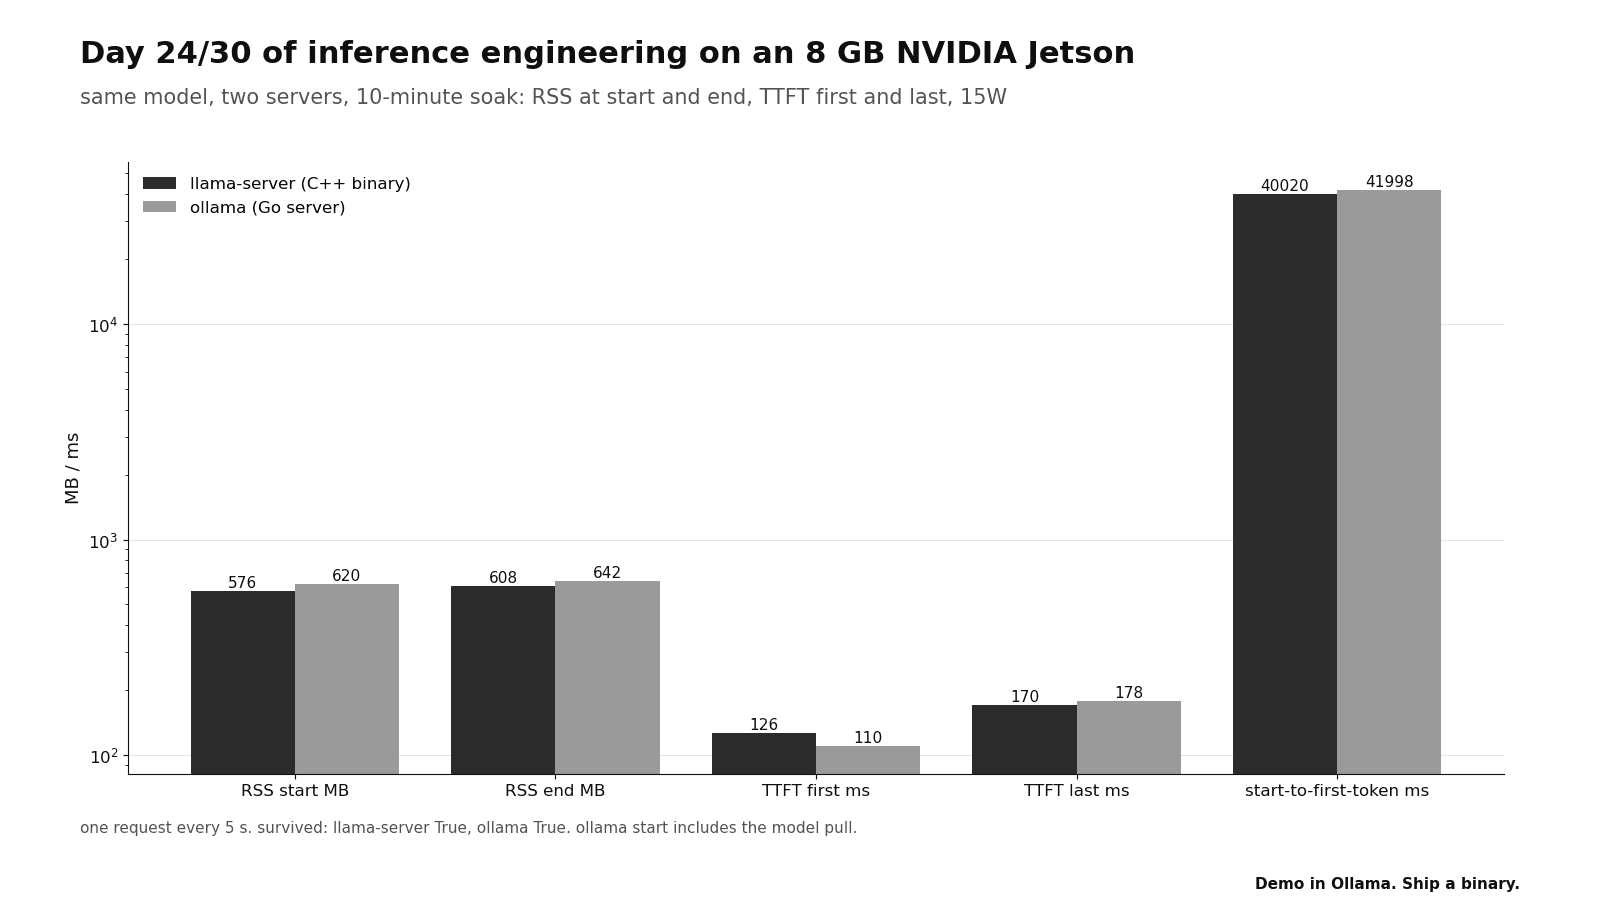
- On a 10-minute soak, llama-server and ollama started in 40,020 and 41,998 ms and decoded at 10.8 and 11.2 tok/s. TTFT was 126 ms on the cold first request and then a flat band, median 184 ms over 65 requests: the per-request series, read on 2026-10-04, shows no drift. RSS never showed the weights.
What I expected
Two servers ran one model file. I expected that the Go server, a wrapper plus a runner, would cost more RAM and start slower. I expected that both servers would be flat in TTFTTime to first token: the delay between sending a request and receiving the first generated token, mostly spent in prefill. and decodeThe phase after prefill where a language model generates one token at a time and re-reads its weights for each one; it is usually limited by memory bandwidth. over ten minutes. I wrote 'flat' as the prediction.
I also expected that the RSSResident set size: the pages of a process's own memory that are in RAM right now, as ps and top count them; GPU allocations made through the driver are not included. column would show the 2.45 GB of weights. Then, to monitor RSS for an hour would be to monitor the model.
The theory
A slope, a fence, a weight, and a clock
The drift, extrapolated (arithmetic)
llama-server: 608 - 576 = 32 MB in 10 min
65 requests: 0.49 MB per request
at this rate: 192 MB per hour
to the fence: (5,500 - 608) / 192 = 25 h
ollama: 22 MB, 0.36 MB per request, 37 h
if the slope is a leak. two points is a line
= a third point tells leak from warm-up
The fence against the field (arithmetic)
usable RAM 7,620 MiB (board)
idle floor 1,498 MiB (Day 25, measured; Day 21 read 2.4 GB and did not log it)
5,500 + 1,498 = 6,998 MiB
7,620 - 6,998 = 622 MiB under the edge
with Day 21's 2.4 GB it would be 280 MiB past
and RSS 608 MiB < 2.45 GB of weights:
the weights are not in RSS at all
= the fence may stand in the wrong yard
A leak grows with requests, and a warm-up saturates. RSS at each minute for an hour separates the two. The fence protects the board only if the cgroup charges the GPU-side buffers to the process and the floor is not reclaimable cache.
Nice = -5 as a scheduler weight (theory, the kernel's CFS table)
- nice 0
- 1024
- nice -5
- 3121
- share vs one nice-0
- 75 %
The setup
python3 ~/day24_serving.py --minutes 10
cat ~/day24/results.json | head -30cp ~/day24/robot-brain.service /etc/systemd/system/
systemctl daemon-reload
systemctl enable --now robot-brain
systemctl status robot-brain --no-pager | head -5"model": "~/models/Qwen3-4B-Q4_K_M.gguf"
"minutes": 10
"llama-server": { "up": true, "start_ms_to_first_token": 40020.221, "rss_mb_start": 576, "rss...
"ollama": { "up": true, "start_ms_to_first_token": 41997.962, "rss_mb_start": 620, "rss_mb_en...
"systemd_unit": "[Unit]\nDescription=robot brain (llama-server)\nAfter=network.target\n\n[Ser...The measurement
| What | Expected | Measured | Note |
|---|---|---|---|
| llama-server: start ms / RSS start-end / survived | - | 40020 ms / 576-608 MB / True | 10 min soak, 0 errors |
| ollama: start ms / RSS start-end / survived | - | 41998 ms / 620-642 MB / True | 0 errors |
| TTFT first -> last, llama-server / ollama | flat | 126->170 / 110->178 ms | the cold first request against one later request; the series row below is the whole soak |
| TTFT, every request, series read 2026-10-04 | flat | 184 ms median, p10 170, p90 193 (n=65) / 162 ms, p10 153, p90 176 (n=61) | after the first request every TTFT sits in that band: a cold start, not a drift |
| decode first -> last, llama-server / ollama | flat | 10.8->10.8 / 11.2->11.3 | tok/s |
The unit as a receipt; the no-brain clock beside it
robot-brain.service (drafted)
ExecStart = llama-server, gguf path, -ngl 99, -c 4096
Restart = on-failure
RestartSec = 2
Nice = -5
WatchdogSec = 30
= MemoryMax = 5500M
Worst case without a brain (arithmetic)
hang: the watchdog waits up to 30 s
+ RestartSec 2 s
+ start to first token 40 s
= 72 s; at 30 fps that is 2,160 frames
crash, not hang: 2 + 40 = 42 s
= the robot needs a no-brain policy: stop
If the 40 s of start is all a disk read, it is 2.45 GB / 40 s = 61 MB/s. A second start with the file already in page cache separates disk from CUDA context.
| item | llama-server | ollama | tag |
|---|---|---|---|
| start to first token | 40,020 ms | 41,998 ms, with pull | * |
| RSS start -> end | 576 -> 608 MB | 620 -> 642 MB | * |
| TTFT first -> last | 126 -> 170 ms | 110 -> 178 ms | * |
| TTFT median (p10 to p90), every request, read 2026-10-04 | 184 (170 to 193) ms, n=65 | 162 (153 to 176) ms, n=61 | * |
| decode first -> last | 10.8 -> 10.8 tok/s | 11.2 -> 11.3 tok/s | * |
| requests / errors | 65 / 0 | 61 / 0 | * |
Where it broke
Decode was flat, 10.8 to 10.8, and I almost wrote 'flat' for the full soak. TTFT looked higher at the end: 126 ms on the first request and 170 on the last for llama-server, 110 and 178 for ollamaA local model server that pulls quantized models by name and serves them over an HTTP API, built on llama.cpp's inference code.. Those two samples are what results.json holds. The run also wrote a per-request series, llama-server_series.json and ollama_series.json, and I read it on 2026-10-04. The first request is the cold one. Every later request sits in a band of 164 to 198 ms for llama-server (median 184) and 148 to 182 ms for ollama (median 162), and the first-half and second-half medians differ by 1 and 4 ms. That is a cold first request, not a drift. 'Rose' compared one cold sample with one ordinary one.
The RSS counter never showed the weights: it gave 608 MB for a 2.45 GB model. The number that I planned to monitor for an hour measures the incorrect thing. The two servers are within 5 % of each other on start time and decode. The argument for the binary was never speed. It is the unit file.
Summary
- Start to first token was 40 s for each server. This is the time that a robot has no brain after a crash. RSS was the number that I planned to monitor for an hour. It showed 608 MB for a 2.45 GB model.
- MemoryMax in the drafted unit is 5,500 MiB. With Chapter 25's measured 1,498 MiB floor it is 622 MiB under usable RAM. With Chapter 21's 2.4 GB reading it would be 280 MiB past. The unit is not installed, so it protects nothing yet.
- The registry and the model pull of ollama are very good on a laptop. On a robot, the model file is a path, and the process is a unit.
Sources
These sources are not mine. Measured numbers came off my own board; specs, estimates and paper figures are labeled as such.
- TensorRT Edge-LLM examples (llm_inference, experimental OpenAI server). llama-server docs. systemd unit patterns for Jetson
- day24/rerun-2026-10-04/summary.json: TTFT of every request, from the llama-server_series.json and ollama_series.json the soak wrote, read 2026-10-04