The 8 GB Lab Book · Chapter 26
VLM latency is not VLA latency
- Board
- Jetson Orin Nano Super
- Mode
- 15W
- Summary
- On Qwen2.5-VL-3B one image-to-action step took 2,617 ms, 76% of it prefill. Per token, the JSON action cost what a caption cost.
What I expected
Same weights, same pass: I expected that an action token would cost exactly the same as a caption token. Each token is one pass over the weights, and the pass is memory bandwidthHow many bytes per second the memory system can deliver; on a shared-memory board the CPU, GPU and video engines all draw from the same supply.-bound (Chapter 2). I expected only one difference. It was in prefillThe first phase of language-model inference, where the whole prompt is processed in one parallel pass to fill the KV cache; it is usually limited by compute., where the action prompt is longer.
I also had a number from the VLAVision-language-action model: a vision-language model extended to output robot actions, often as a short chunk of future commands. papers. On Orin-class boards, the papers put most of a step, approximately 75%, into the production of the action. I expected that my proxy would give a value near that number.
The theory
Decode per token = weight bytes / bandwidth, then check it twice
Qwen2.5-vl-3b, the floor (estimate)
LM weights: 3 B x 4.5 bit / 8 = 1.7 GB
one decode pulls 28 GB/s (Day 2)
floor = 1.7 GB / 28 GB/s = 61 ms per token
at the 68 GB/s roof it would be 25 ms
= caption: 1,054 / 16 = 66 ms per token
The action, counted honestly
budget 16 tokens, stopped at the brace
the JSON is 10 tokens (eval_tokens in the log)
638 ms / 10 = 64 ms per token
caption 66, action 64
= same per token, as predicted
The 500M model is 3 ms per token above its own floor. The measured value is 211 / 16 = 13 ms. The floor is 0.5 B x 4.5 bit / 8 = 0.28 GB / 28 GB/s = 10 ms. My guess is launch overhead, the cost that Chapter 7 removed from the preprocess by kernel fusionCombining several GPU operations into one kernel so intermediate results stay on chip instead of making a round trip through DRAM..
The step, split (measured, 3B, the action run)
- prefill
- 1,979 ms
- decode
- 638 ms
- decode share
- 24%
The setup
python3 ~/day26_vla_proxy.py
cat ~/day26/results.json | head -40"server": "~/llama.cpp/build/bin/llama-server" "image": "~/day19/img_hi.jpg" "note": "16 new tokens each. Same image. Caption vs forced JSON action. The delta in prefill+...
The measurement
| What | Expected | Measured | Note |
|---|---|---|---|
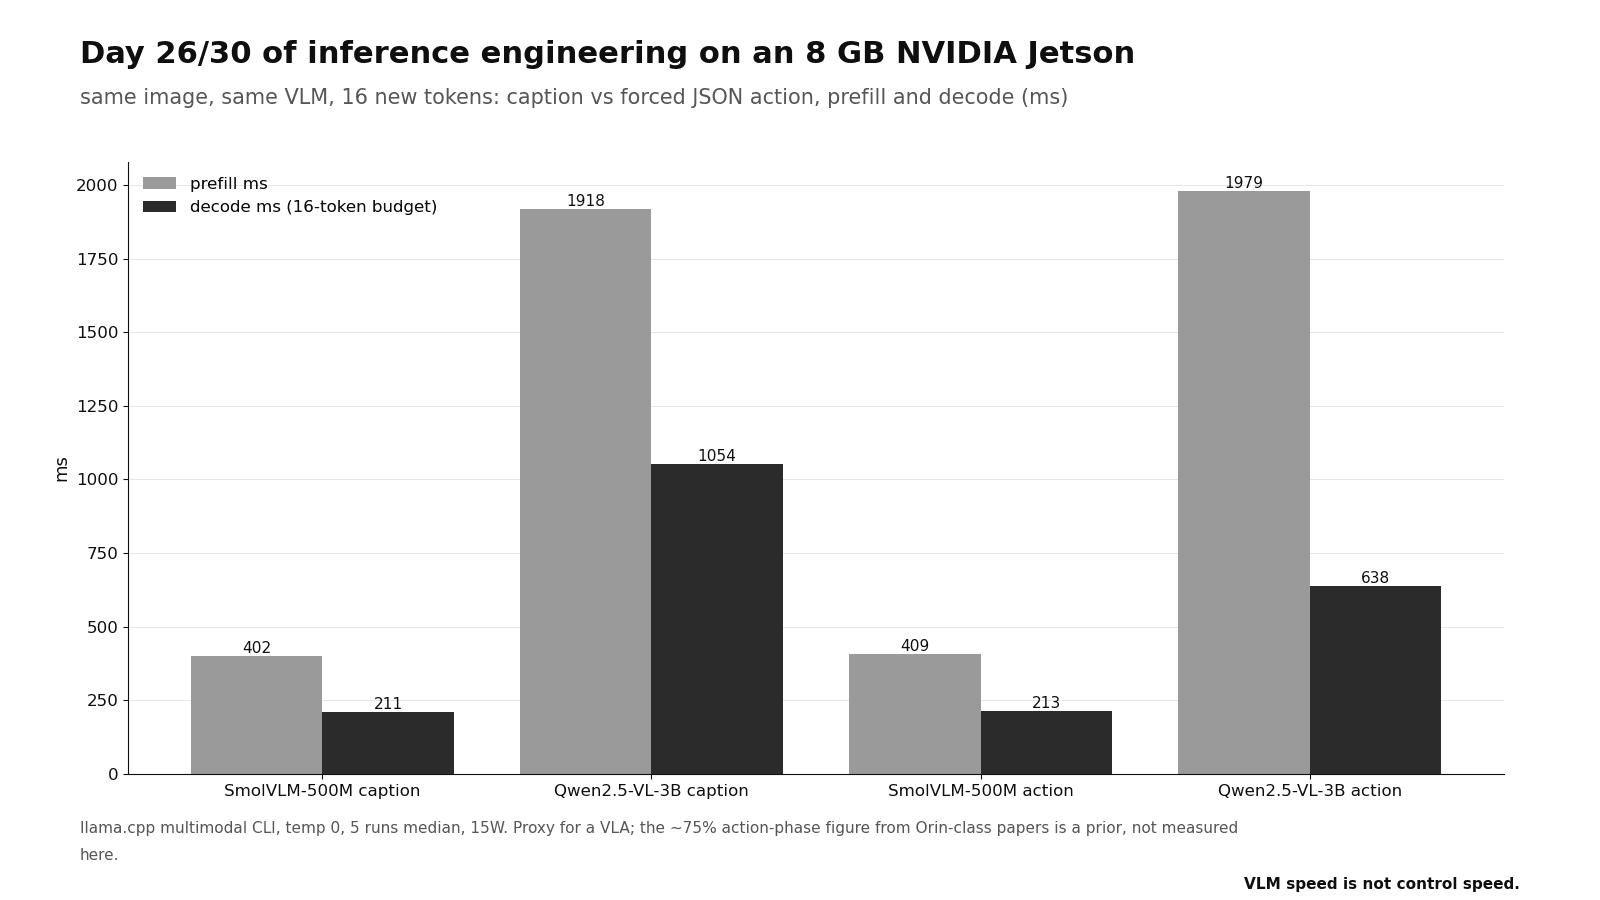
| SmolVLM-500M: caption / action decode ms (16 tok) | same per token | 211 / 213 | prefill 402 / 409 ms; JSON valid 0/5 |
| Qwen2.5-VL-3B: caption / action decode ms (16 tok) | same per token | 1054 / 638 | prefill 1918 / 1979 ms; JSON valid 5/5 |
One step, image to action (3B, measured)
- Imagevision tokens
- Prefill1,979 ms
- Decode638 ms
- JSON action10 tokens
Prefill and decode, caption against action (3B)
| model | cap pre | cap dec | act pre | act dec | JSON /5 |
|---|---|---|---|---|---|
| SmolVLM-500M | 402 | 211 | 409 | 213 | 0 |
| Qwen2.5-VL-3B | 1,918 | 1,054 | 1,979 | 638 | 5 |
Where it broke
The 638 misled me for a short time. The action was forty percent cheaper than the caption, and this reads as if acting is cheaper than talking. It is not. The action ended early at the closing brace. A budget is a limit, not a count, and I compared two limits. The numbers for each token are the numbers that agree.
The second result is that the 500M gave 0 valid JSON in 5 tries. It gave a prose sentence instead, at the same cost for each token. The model could not keep the shape. Talking and acting differ in exactness, not in milliseconds. Exactness comes from the model, not from the stop string.
Summary
- Per token, a caption and an action cost the same on the 3B: 66 ms and 64 ms. My action was 10 tokens, the log's eval_tokens, and stopped at the closing brace. Decode was 24% of the step, not the papers' 75%.
- Prefill is the other half. The action prompt is longer, and vision tokens (Chapter 19) are in front of it on each step.
- The headline Hz of a VLA counts chunks, one chunk for each forward. Chunks per second x actions per chunk gives action throughput. It does not give latency. The first action of a chunk waits for the full forward. Compare that forward time with the two clocks on Chapter 29. Do not compare the share of each action.
Sources
These sources are not mine. Measured numbers came off my own board; specs, estimates and paper figures are labeled as such.
- arXiv 2603.02271 VLA characterization on Orin/Thor (action-phase bottleneck ~75%)
- Your Day 22 prefill/decode split applied to actions instead of words